

What Is a Dividend Yield? A Simple Investor’s Guide 2026

Dividend yield is the annual dividend a company pays for each share of stock, divided by that share’s current price and expressed as a percentage. If a share costs 100.00 and pays 4.00 a year, the dividend yield is 4%. That is the whole idea: it turns a cash payment into a rate you can compare across companies, funds and bonds.
The catch is that the share price sits in the denominator, so the ratio moves on its own every time the price moves. A yield that looks generous may simply be telling you the market has repriced the business. Below is how the number works, where it misleads, and what to check beside it.
What Is a Dividend Yield?
A dividend is a cash distribution a company pays to its shareholders out of profits. Most US companies pay quarterly, four times a year, and the board declares each payment before it is paid. Dividend yield puts a number on that payment relative to what you pay for one share.
Only two inputs go into it. The first is the annual dividend per share, meaning the four most recent quarterly payments added together. The second is the current share price. The result is always expressed as a percentage because the raw quotient is tiny — four dollars over a hundred dollars is 0.04, not 4.
Dividend Yield = (Annual Dividend Per Share ÷ Share Price) × 100
That ratio tells you how much cash income one dollar of purchase price generates per year, before tax. It is not the same as your return. If the share price climbs, your total return can be far higher than the yield; if it falls, the yield can be generous and your return still negative.
How Is a Dividend Yield Calculated?
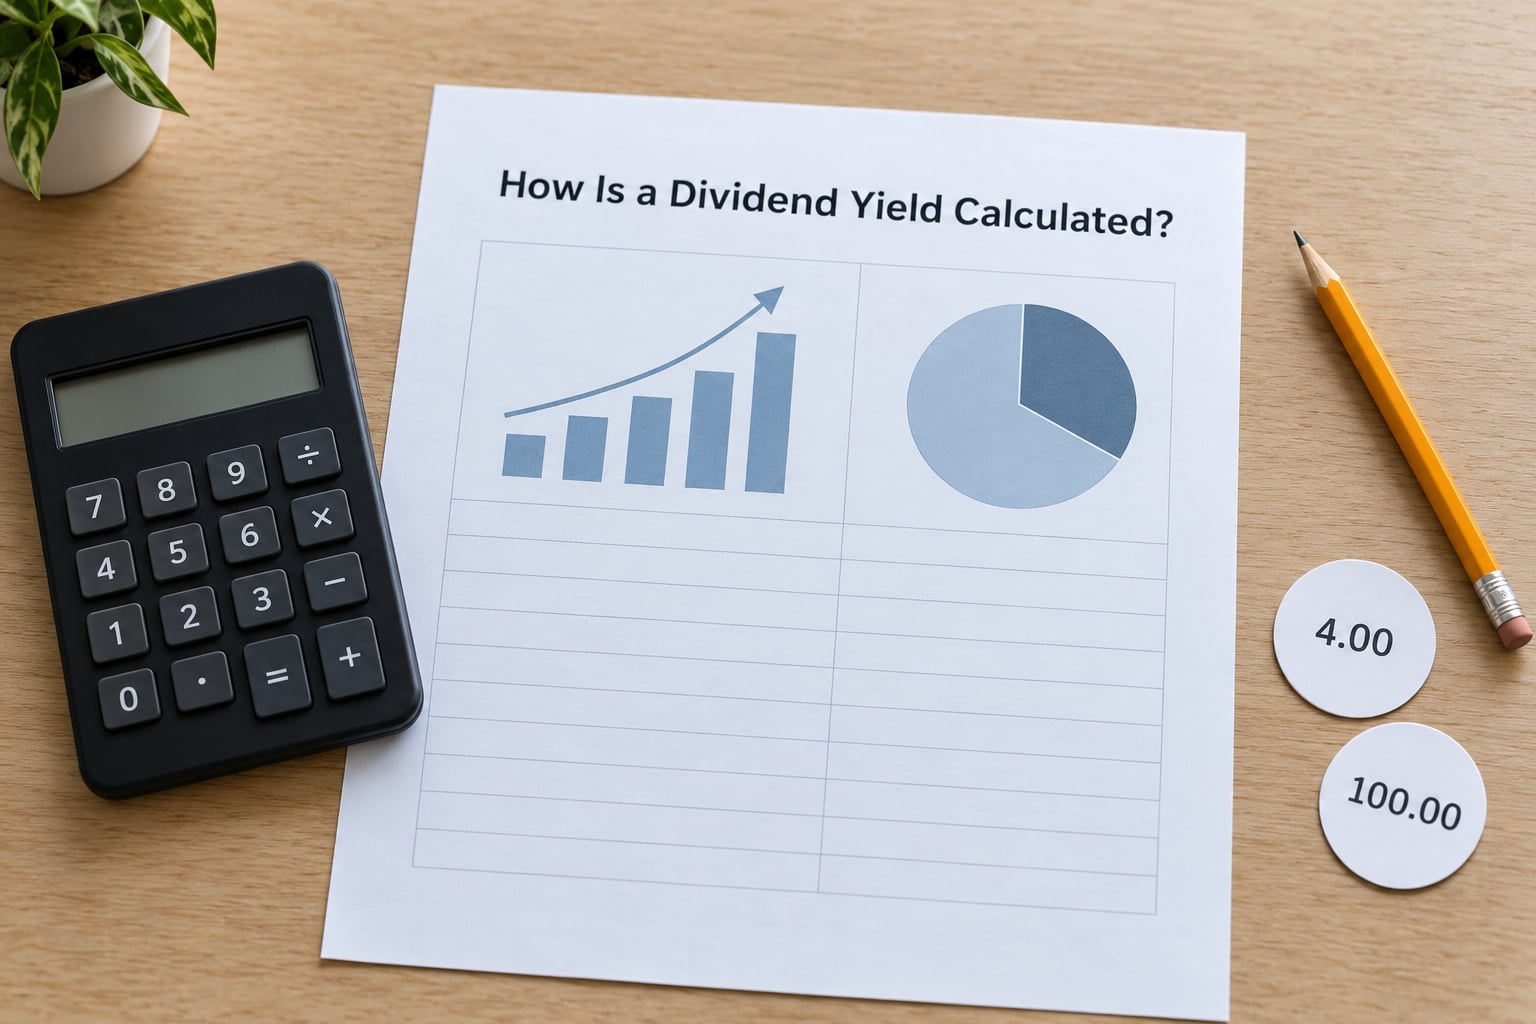
Four steps, and the one people get wrong is usually the first. Here is what each input means.
| Input | What it is | Where to find it |
|---|---|---|
| Annual dividend per share | The last four quarterly dividends added together | The company’s dividend history page or your broker’s dividend history tab |
| Current share price | The price of one share right now | Any quote page, your broker, or the top of your screener |
| × 100 | Converts the decimal into a percentage | Nothing to look up |
Add the four quarters first, then divide once. Dividing each quarter separately by the price and adding the results gives a slightly different and less useful figure.
Because the price is in the denominator, the yield falls as the price rises and rises as the price falls. The dividend below stays at 4.00 a share the whole way down the table.
| Share price | Annual dividend | Dividend yield |
|---|---|---|
| 200.00 | 4.00 | 2.0% |
| 150.00 | 4.00 | 2.7% |
| 100.00 | 4.00 | 4.0% |
| 80.00 | 4.00 | 5.0% |
| 50.00 | 4.00 | 8.0% |
Nothing changed about the company’s payout between the top row and the bottom row. Only the market’s opinion of the share did. Keep that in mind every time a yield jumps in your screener.
Dividend Yield Example for a Stock
Say a hypothetical industrial company called Meridian Components pays 0.85 a share each quarter. The share trades at 68.00. Multiply the quarterly payment by four to get 3.40 a year, then divide by the price: 3.40 ÷ 68.00 = 0.05, and 0.05 × 100 = a 5% dividend yield.
Now translate that into position size. A 5% yield on a 10,000 position produces about 500 a year, or roughly 125 a quarter. If the price drops to 51.00 with the dividend unchanged, the same position shows a yield near 6.7% — and nothing about the business improved to make that happen.
Meridian is made up, but every calculator you will meet online is doing exactly this arithmetic on your holdings. If your broker’s dividend history tab lists three payments rather than four, annualising the most recent one is a reasonable stand-in until the fourth arrives.
What Is the Difference Between Dividend Yield and Dividend Payout Ratio?
Dividend yield measures the dividend against the share price. Payout ratio measures the same dividend against earnings. One tells you what the income looks like on your purchase price; the other tells you how much of the profit is being handed out instead of reinvested.
| Measure | Formula | What it tells you |
|---|---|---|
| Dividend yield | Annual dividend per share ÷ share price × 100 | Annual income as a percentage of what you pay |
| Payout ratio | Annual dividend per share ÷ earnings per share × 100 | How much of each year’s profit is paid out |
| Dividend cover | Earnings per share ÷ dividend per share | How many years of dividends current earnings could fund |
Worked on the same company: 3.40 of dividends against 8.50 of earnings per share gives a payout ratio of 40%, and earnings of 8.50 covering a 3.40 dividend gives cover of 2.5 times. The yield, at 5%, says nothing about any of that. A company paying out 90% of a booming year’s profit and one paying out 40% of a shakier one can show identical yields when the price moves to compensate.
The practical rule most income investors use is that a payout ratio below roughly 50% to 75% of earnings leaves room for bad years. At or above 100%, the dividend is being funded from the balance sheet or borrowings, and the cut risk is real.
Is a Higher Dividend Yield Better?
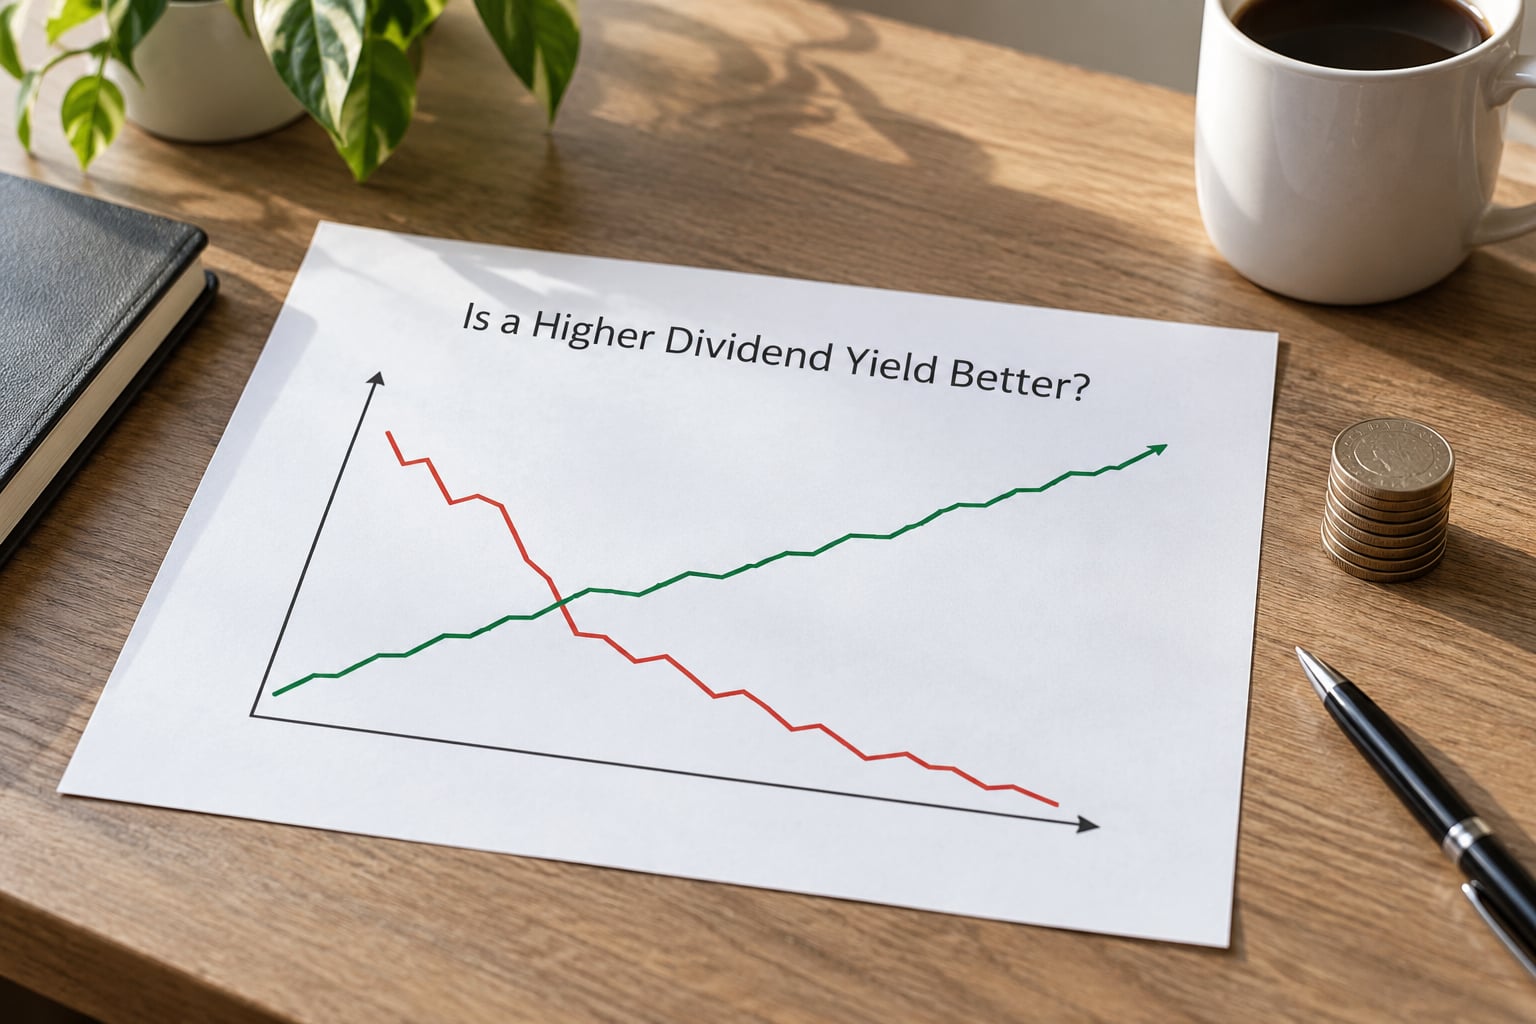
Not on its own. A high dividend yield attracts investors because the cash income looks large, and that inflow is often what pushes the share price up and the yield back down. But the same number shows up for two very different reasons, and telling them apart is the useful part.
The first reason is that the share price has fallen. When the market reprices a business sharply lower while the board keeps the dividend steady, the yield jumps immediately. That is a warning about the business, not a discount for you. A yield in the high single digits is the classic signal that something is wrong, and that heuristic comes up constantly in dividend investing communities.
The second reason is that the company is genuinely cheap, usually because it is in a mature industry with predictable cash flows and little reinvestment opportunity. Mature utilities, banks and real estate investment trusts routinely sit in the mid single digits because their business genuinely cannot grow much. That yield is compensation for a low growth rate, not a free lunch.
The trap is when a cyclical business is caught near the top of its cycle. Energy producers, miners and parts of the financial sector generate payouts that track commodity and credit conditions, so the yield looks spectacular right before earnings roll over. On our site we lean on precious metals and mining companies often enough to see this pattern repeat: distributions that swell with a strong commodity price and quietly shrink when the price turns.
What Affects a Stock’s Dividend Yield?
Five things move the number, and it helps to know which one you are looking at when it changes.
- The dividend itself. A raise lifts the yield; a cut drops it immediately. Board decisions show up in the numerator.
- The share price. This is the big one. Price rallies compress yields, selloffs expand them, and neither says anything about the payout.
- Share count changes. Sustained buybacks shrink the share count and raise earnings and dividends per share, which quietly lifts yield over time.
- Interest rates and bond yields. Higher rates push income alternatives like Treasuries and corporate bonds up, and income investors often demand more from equities. Sector yields shift with the curve.
- One-off payments. A special dividend inflates the trailing yield for one period and then disappears. Several screeners now show a special-dividend-adjusted figure precisely because this confuses people.
That last point explains a puzzle worth knowing about. Two sites can quote different yields for the same share on the same day and both be correct.
| Measure | How it is built | When it differs |
|---|---|---|
| Trailing yield | The four most recent payments, including any one-off special | Inflated by a special dividend |
| Forward yield | The most recent quarterly payment multiplied by four | Ignores a raised annual dividend and assumes no change |
Forward yield looks lower when a company has just raised its dividend, and higher when a cut is expected. Neither is wrong; they answer different questions about the past and the near future.
How Do Investors Use Dividend Yield?
Used well, it is a normalisation tool. It puts income from a 40.00 share and a 400.00 share on the same scale, which is what makes screening possible at all.
The first job is comparison. Investors line up yields across a sector, then compare the winning names against the yield on a Treasury or a corporate bond. For context, the S&P 500’s dividend yield has sat in a low single-digit range in recent years, mostly around 1% to 1.5%, while 10-year Treasury yields have spent the last several years in the 3% to 5% band. Check the current figure on an index provider’s page before you rely on any number quoted here, because both move.
The second job is income translation. To work out what a target monthly income costs, divide the annual target by the yield and then by 12. For 12,000 a year at a 4% yield you need 300,000 invested; at 5% you need 240,000. The same income at a 6% yield needs only 200,000, which is exactly why chasing the top of a yield list feels so persuasive and so dangerous.
The third job is tracking what you actually own. Investors who bought at a lower price describe their personal figure as yield on cost, calculated with their original purchase price in the denominator rather than today’s price. Yield on cost stays fixed as the market moves; current yield follows the share price down. r/dividends and r/investingforbeginners threads are full of beginners surprised that their reported yield fell without any change to their holdings, and this is almost always why.
A dividend reinvestment plan, or DRIP, feeds each payment back into buying more shares automatically. It pairs naturally with yield on cost because every reinvested payment raises the cost basis of future income.
What Are the Risks of Looking Only at Dividend Yield?
The main risk is treating income as if it were a coupon. It is not guaranteed, and it is not the same as your return.
Taxes. In the US, most dividends from US companies and many from foreign ones are qualified dividends, taxed at long-term capital gains rates of 0%, 15% or 20% depending on taxable income. Dividends from some foreign issuers, and distributions from REITs and some funds, are taxed at ordinary income rates. Your after-tax yield is therefore lower than the headline, and the gap widens in higher tax brackets. Rates and thresholds change, so confirm the current brackets with a tax professional rather than an article, including this one.
Cuts. The payout ratio tells you how much earnings the dividend consumed last year. Check that it has not been near or above 100% for several years running, and that free cash flow has covered the payout as well.
Balance sheet. Debt load matters, especially for banks and capital-intensive businesses. Investors commonly look at debt against EBITDA and compare it with peers in the same sector.
Track record. A company that has raised its dividend for twenty-plus consecutive years has survived downturns that broke weaker competitors. That record tells you more about durability than the current yield does.
Sector context. Compare a yield against its own sector average, not against a broad index. A 5% yield is unremarkable for a real estate investment trust and alarming for a software company.
It is not total return. Yield counts only the cash. Price appreciation and dividend growth are the other two components, and for long-horizon investors dividends have historically supplied a large share of the index’s total return. A high-yield share that falls 30% while paying 6% still lost a quarter of your money.
Nothing here is investment advice, and none of the examples name a real company. Rules, tax rates and market data vary by country and change over time, so verify anything that matters to your portfolio with your broker or a qualified adviser.
Frequently Asked Questions
A good dividend yield depends entirely on the sector and on interest rates. Broad US large-cap indexes have typically yielded in the 1% to 1.5% range, while mature utilities, banks and real estate investment trusts often sit in the 4% to 6% band. Rather than hunting for a target number, compare the yield against its own sector average and against what a Treasury or corporate bond is offering right now.
Yes, in most countries dividends are taxable income. In the US, qualified dividends from most US companies are taxed at long-term capital gains rates of 0%, 15% or 20% depending on your taxable income. Dividends from certain foreign companies, real estate investment trusts and some funds are taxed at ordinary income rates instead. Tax rules change, so check current brackets with a tax professional.
Divide 1000 by 12 to get 12,000 a year, then divide that by your target yield. At a 3% yield you need about 400,000 invested; at 4%, 300,000; at 5%, 240,000; at 6%, 200,000. Work out the amount before you shop, because chasing a higher yield to shrink the number is how beginners end up holding companies that cut the payout.
Dividend yield divides the annual dividend per share by the share price. Payout ratio divides that same dividend by earnings per share. Yield measures income relative to what you pay, so it changes every time the price moves. Payout ratio measures income relative to profit, so it shows how much of each year’s earnings is being paid out and how much room is left before a cut.
For most mature companies a payout ratio above roughly 75% of earnings leaves little room, and anything at or above 100% means the dividend is not fully covered by that year’s profit. Cyclical businesses can run high in a strong year without being in danger, so compare several years rather than one. Free cash flow coverage is a useful second check on the reported earnings figure.
Usually it means the opposite. A very high yield almost always reflects a share price that has already fallen hard, or a one-off special dividend, or a business whose earnings are deteriorating. Investors who rank a screen by yield alone tend to buy the most distressed names in the list. Check the payout history and the balance sheet before treating a double-digit yield as an opportunity.
Conclusion: Use Dividend Yield as a Starting Point
Dividend yield is the annual dividend per share divided by the current share price, times 100. That one formula tells you how much cash income a dollar of purchase price generates each year, and nothing more than that.
Use it to compare companies, funds and bonds on one scale, and to translate a position into a monthly cash figure. Before you act on it, check the payout ratio, the free cash flow behind it, the debt load, the sector average and how long the dividend has survived. That second list is where the actual decision lives.
Source: https://www.pgm-blog.com/what-is-a-dividend-yield/
Anyone can join.
Anyone can contribute.
Anyone can become informed about their world.
"United We Stand" Click Here To Create Your Personal Citizen Journalist Account Today, Be Sure To Invite Your Friends.
Before It’s News® is a community of individuals who report on what’s going on around them, from all around the world. Anyone can join. Anyone can contribute. Anyone can become informed about their world. "United We Stand" Click Here To Create Your Personal Citizen Journalist Account Today, Be Sure To Invite Your Friends.
LION'S MANE PRODUCT
Try Our Lion’s Mane WHOLE MIND Nootropic Blend 60 Capsules
Mushrooms are having a moment. One fabulous fungus in particular, lion’s mane, may help improve memory, depression and anxiety symptoms. They are also an excellent source of nutrients that show promise as a therapy for dementia, and other neurodegenerative diseases. If you’re living with anxiety or depression, you may be curious about all the therapy options out there — including the natural ones.Our Lion’s Mane WHOLE MIND Nootropic Blend has been formulated to utilize the potency of Lion’s mane but also include the benefits of four other Highly Beneficial Mushrooms. Synergistically, they work together to Build your health through improving cognitive function and immunity regardless of your age. Our Nootropic not only improves your Cognitive Function and Activates your Immune System, but it benefits growth of Essential Gut Flora, further enhancing your Vitality.

Our Formula includes: Lion’s Mane Mushrooms which Increase Brain Power through nerve growth, lessen anxiety, reduce depression, and improve concentration. Its an excellent adaptogen, promotes sleep and improves immunity. Shiitake Mushrooms which Fight cancer cells and infectious disease, boost the immune system, promotes brain function, and serves as a source of B vitamins. Maitake Mushrooms which regulate blood sugar levels of diabetics, reduce hypertension and boosts the immune system. Reishi Mushrooms which Fight inflammation, liver disease, fatigue, tumor growth and cancer. They Improve skin disorders and soothes digestive problems, stomach ulcers and leaky gut syndrome. Chaga Mushrooms which have anti-aging effects, boost immune function, improve stamina and athletic performance, even act as a natural aphrodisiac, fighting diabetes and improving liver function. Try Our Lion’s Mane WHOLE MIND Nootropic Blend 60 Capsules Today. Be 100% Satisfied or Receive a Full Money Back Guarantee. Order Yours Today by Following This Link.


| Visits: | 1,834,037,191 |
| Stories: | 8,715,887 |
Whistler Blowers, Insiders

