

How Oil Prices Are Set: Supply, Demand, and Risk (October 2026)

Crude oil is priced on global futures exchanges, chiefly ICE Brent and NYMEX WTI, where supply, demand, expectations and geopolitics meet. No single country, company or organization sets the price. OPEC influences it through production policy, not by declaring a number.
That answer surprises most people, because the folk story is that somebody decides the price of oil. There is no oil czar. What there is, instead, is a global balancing act in which millions of barrels a day move every trading session and the last trade sets the going rate.
So how oil prices are set comes down to three forces, in roughly this order: the physical balance of supply and demand, geopolitics that threaten barrels, and financial traders positioning in the futures market. Below I take each one apart, name the benchmarks, show how a physical barrel actually gets invoiced, and give you a weekly checklist for following the market.
Updated for October 2026.
What Determines the Price of Crude Oil?
The price of crude oil is determined by what a buyer will pay for the marginal barrel on the day, adjusted for quality and location. Crude is not one product. It varies in density, sulfur content and viscosity, and those differences change what a refinery can do with it and what it has to pay.
Four terms do most of the explaining here:
- Benchmark crude — a standard grade used as the reference point for pricing everything else. Brent and West Texas Intermediate are the two that matter to almost everyone.
- Spot price — the price for a physical barrel changing hands today for near-immediate delivery.
- Futures contract — a standardized promise to buy or deliver a barrel at a set price on a set date. The futures price is where most price discovery happens, and it converges on the spot price as delivery dates approach.
- Price differential — the plus or minus amount added to the benchmark to reflect quality and delivery location. This is the piece almost every plain-language article skips.
Here is the part that matters most. Very little oil is actually bought on an exchange. The physical trade happens over the counter, where a cargo of, say, a heavy sour crude from Canada is priced as its benchmark grade plus a differential agreed against quality and freight. Around two-thirds of internationally traded oil is referenced to Brent on most industry estimates, which is why Brent moves tend to be the headline number in European and Asian coverage.
There is a reason nobody can simply raise prices when costs go up. Oil is fungible: a barrel is measured against a standard, so a buyer with one grade can often swap in another. That makes producers and refiners price-takers, in the same way a supermarket is a price-taker when it raises the price of milk. They pass costs through; they do not create the price.
How Oil Prices Are Set Through Supply and Demand
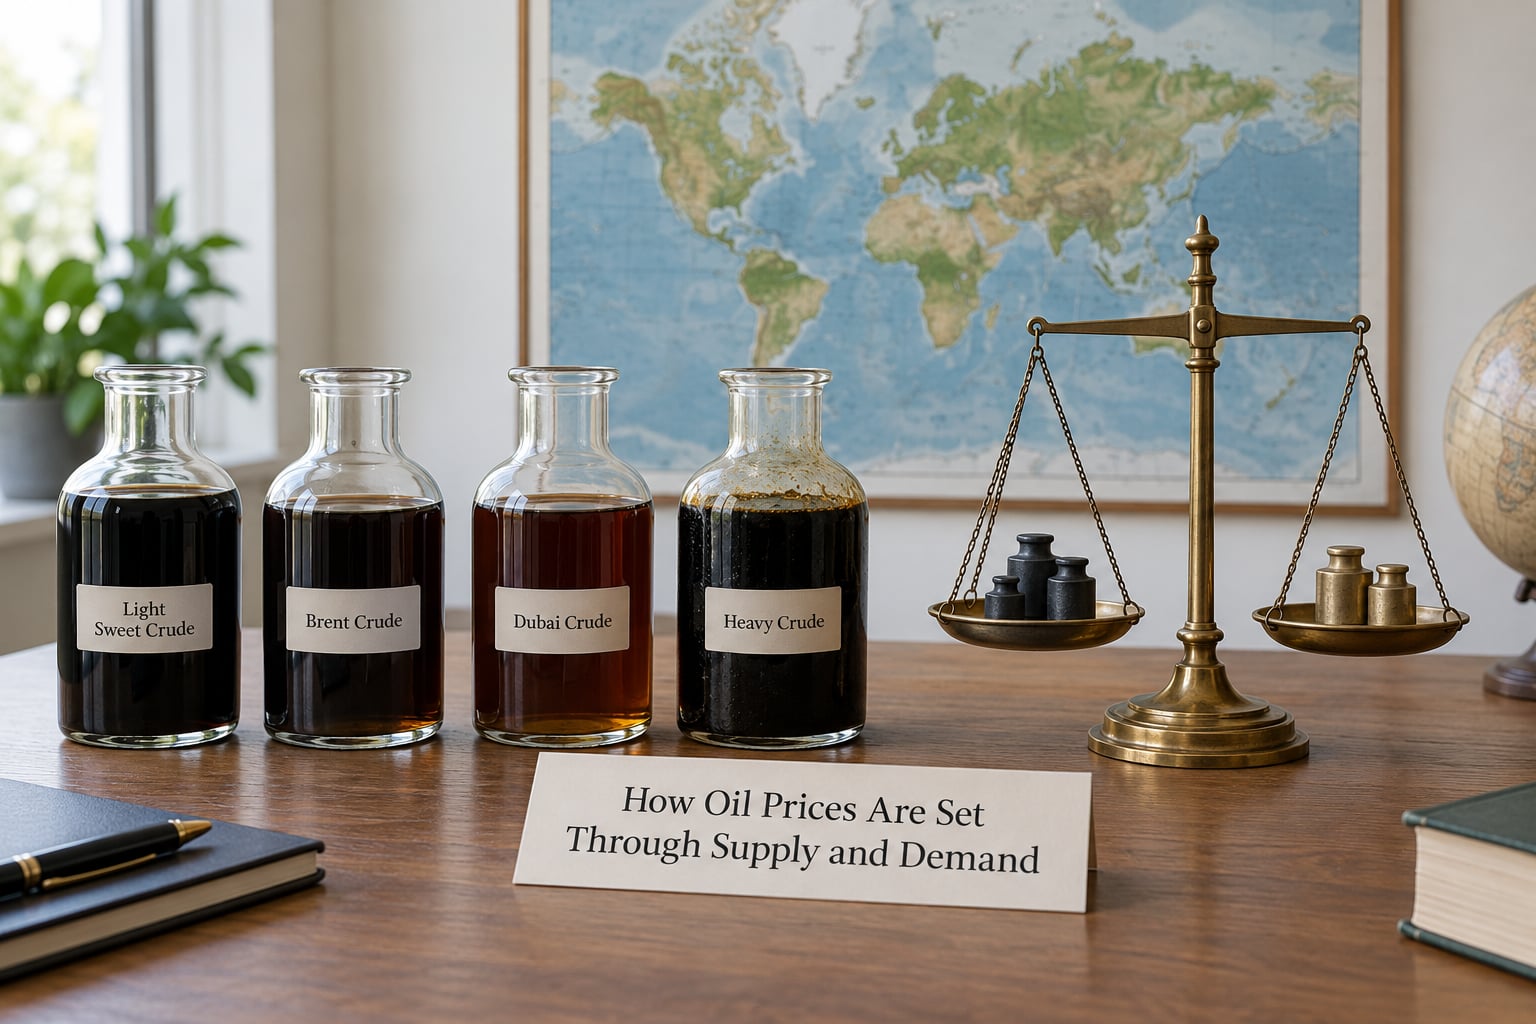
At the core, the mechanism is the familiar one. Producers offer barrels, refiners and everyone downstream need them, and the price rises when buyers want more than sellers can supply. When supply exceeds what buyers want, the price falls. The unusual part of oil is how sticky demand is and how slow supply can respond.
Short-run price elasticity of oil demand is often estimated at close to minus 0.1, meaning a 10 percent price move changes consumption by about 1 percent. You cannot easily drive less or postpone a delivery. On the supply side, tapping a new field or building a pipeline takes years. When something forces a mismatch, the price has to move a long way, and fast.
How oil prices are set in practice: a barrel’s invoice price
Say Brent trades at 74 dollars a barrel and a refiner wants a cargo of medium sour crude from a Latin American producer. The commercial invoice does not say 74. It says the benchmark plus or minus a differential, decided against four things: how much it costs to refine (heavier, higher-sulfur barrels yield less valuable fuel and cost more to process), how far it has to travel, whether it matches what the refinery already has in its pipeline, and how tight that regional market is at the time.
In that example, the crude might be priced at Brent minus 3.50 dollars. Refiners buying light sweet crude in the same region might pay Brent plus 2 dollars. The two cargoes can be chemically similar and trade 5.50 dollars apart because of where they sit and what they are.
This is why headline benchmark moves are a rough guide rather than a receipt. It is also why quality spreads move on their own schedule. When refinery capacity shuts down, the market for light sweet crude tightens separately from heavy sour, and the differential moves even if Brent barely budges.
The eight drivers, in the order they usually hit
When you see a move in oil prices, these are the usual suspects:
- The supply and demand balance. The base layer. Compare expected production against expected consumption for the period.
- OPEC+ policy. Quotas, voluntary cuts and whether members actually comply with them.
- Inventories. Weekly builds and draws, and where the commercial barrels are sitting.
- Geopolitics. Sanctions, conflict, shipping disruption and pipeline outages.
- The US dollar. Oil is priced in dollars, so dollar strength pressures the price from the side.
- Macro and risk sentiment. Growth forecasts, employment data, and whether investors are buying or selling risk generally.
- Refining capacity. Outages and turnarounds move refined product prices even when crude is quiet.
- Expectations and positioning. What traders already think is coming, expressed through futures.
Does the futures market set the price, or the physical one?
Plenty of people argue about this, and honestly it is contested. One camp says futures set it, because the volume of contracts traded on a screen far exceeds the number of physical cargoes, and price discovery happens where the trading is. The other says physical cargo deals, pipeline commitments and refinery bids set it, and futures just reflect them.
The more careful position, from Bassam Fattouh’s work at the Oxford Institute for Energy Studies, is that the price is co-determined. Both layers feed each other, and which one leads depends on the moment. During the 2008 run-up the paper market led; at certain points in the 2014-2016 shale wave the physical market set the pace. Treat any confident one-way answer with suspicion.
One more practical wrinkle worth knowing. Speculation is not the same as manipulation, and open interest is not the same as a bet on direction. Producers, refiners, airlines and banks hold futures, mostly as hedges: a producer selling forward is locking in a price, an airline buying forward is fixing its fuel cost. Open interest measures how many contracts are live, not how bullish anyone is. That distinction gets lost in most public argument, including in trading forums, where the accusation is almost always “speculators” and almost never a position sheet.
Why Do Different Oil Benchmarks Have Different Prices?
Benchmarks differ by where they deliver, what grade they represent and which regional market they anchor. The four below cover most of the world.
| Benchmark | Exchange | Delivery point | Typical crude | What it prices |
|---|---|---|---|---|
| Brent | ICE Futures Europe | Sullom Voe, Shetland, UK | Light sweet | Waterborne global crude, the Europe and Asia reference |
| West Texas Intermediate | NYMEX (CME Group) | Cushing, Oklahoma | Light sweet, low sulfur | US crude and the US macro picture |
| Dubai | Dubai Mercantile Exchange | UAE | Medium sour | Asian imports and official selling prices |
| Murban | Platts / Asian markets | Abu Dhabi, UAE | Light sour | Lower-sulfur Middle Eastern grade for Asia |
Brent is light and relatively low in sulfur, which is what a modern refinery wants and what makes it the natural global reference. It is also a waterborne grade, which links it directly to tanker freight and to the Atlantic Basin. WTI is lighter and lower in sulfur still, which is why it usually trades above Brent, and it is landlocked at Cushing, which is why it carries a sharper link to US pipelines, storage and export terminals.
The Brent-WTI spread is a permanent question in retail conversation, and it is asked constantly on forums by people who reasonably assume there is only one global price. The spread is usually a few dollars, but it widens when US export capacity fills up or when pipelines are constrained, because the US then has to compete harder for foreign buyers. It narrows when US export infrastructure is running freely and when global sour supply is loose.
That is the whole logic of light versus heavy. A refinery built for heavy sour crude wants more of it; a complex refinery configured for maximum gasoline yield wants light sweet. When refinery demand for light barrels runs ahead of supply, the light sweet differential rises, and WTI or Dubai pushes away from Brent. Prices of the actual molecules follow processing economics, not a single headline number.
How Do OPEC Decisions and Production Changes Affect Prices?
First, the correction, because it is the most repeated error in this topic. OPEC does not set the price of oil. The group of producers and their allies, OPEC+, decides how much to produce, and the market decides what that production is worth. When OPEC+ cuts a lot, it can move the price. When it cuts a little, it usually does not.
That distinction matters more than it sounds. A group with real spare capacity has room to remove barrels and let the market tighten. A group with no spare capacity has less: it can withhold output, but it cannot conjure a shock, and it cannot produce a rally out of a policy that changes nothing in the physical market. Announcements are cheap. Delivery is the hard part.
Quotas, voluntary cuts, and the compliance question
OPEC+ works through two layers. Required production levels are allocated to each member. On top of that, the group has repeatedly agreed voluntary reductions, with named barrels per country, to be phased in and unwound. Saudi Arabia, Iraq, the UAE, Russia and the others carry most of the weight, and Saudi Arabia in particular has spent years swinging its output up or down faster than almost anyone else, which is why it is treated as the group’s effective balancer.
Compliance gets checked constantly, and the question of whether members are actually cutting what they promised follows every meeting. Compensation announcements usually come with a promise of additional reductions later. The market reads these carefully because the gap between the headline number and the delivered number is where surprises live.
The marginal barrel and the cost curve
Over the long run, the price is set by the most expensive barrel still needed. That is the marginal barrel, and finding it means walking the global cost curve from cheap to expensive: conventional onshore output in places with mature infrastructure comes first, offshore and deepwater next, oil sands and heavy crude near the end, and shale somewhere in the middle depending on the region.
Shale sits there because it responds to price. Producers can bring wells online in weeks rather than years, and they watch the futures curve for months ahead. That makes US shale the swing producer, and it is the reason rallies get cut off so abruptly: at some price, enough shale supply arrives to cap the move, and the market knows roughly where that price is. Operators do not publish the number because it is commercially sensitive, so estimates move around.
What actually happened, cycle by cycle
Every big move in oil prices has a specific cause attached, and recognizing the pattern helps you read the next one.
| Period | Roughly what happened | The cause |
|---|---|---|
| 1948 to 1970 | Around 2.50 to 3.00 dollars a barrel, remarkably stable | Post-war capacity growth keeping ahead of demand |
| October 1973 to 1974 | Quadrupled to above 10 dollars | The Arab oil embargo after the Yom Kippur War, on a market already tight |
| 1979 to 1981 | Around 35 dollars | The Iranian revolution and the Iran-Iraq war removing barrels |
| 1986 | Fell below 10 dollars | OPEC lost control of the market as non-OPEC supply grew and members cheated quotas |
| 1990 to 1991 | Spiked then faded quickly | Iraq’s invasion of Kuwait and the Gulf War, resolved without lasting supply loss |
| 1998 to January 1999 | Near 11 dollars WTI | Asian financial crisis demand collapse plus oversupply |
| July 2008 | About 147 dollars a barrel intraday | Years of underinvestment meeting a supply-demand gap the market could not paper over |
| 2014 to 2016 | Fell by more than half | The shale supply wave arriving faster than expected, with OPEC choosing not to defend its quotas |
| April 2020 | WTI front-month settled below minus 38 dollars | Lockdown demand collapse with nowhere to put stored barrels |
| 2022 | Rapid climb toward triple digits | Russia’s invasion of Ukraine and the sanctions that followed |
The 1986 collapse and the 2020 crash deserve one more line each, because both teach something the rallies do not. In 1986, a group with market power failed to use it because internal discipline broke. In 2020, demand disappeared faster than any producer could respond, and price had to clear a physical glut of storage.
What Role Do Inventories, Refining, and Seasonality Play?
Inventories are the bridge between the slow-moving balance and the daily price. A market can be roughly balanced over a year and still swing 5 percent on a Tuesday, because what matters is whether the barrels are where the buyers are.
Two numbers matter most: the volume of the weekly build or draw, and days of supply, which is inventory divided by consumption. Draws tighten the market and support prices. Builds do the opposite. A surprise draw of 5 million barrels moves futures more than a 5 million barrel draw would have a year ago, simply because traders have priced in the expectation and the surprise does the work.
Refining matters just as much, and it is why gasoline can be expensive while crude is flat. Refineries convert crude into products, and the value of that conversion is the crack spread, the margin between the product price and the cost of the barrel. When a refinery goes offline, or when a region heads into a heating season or a driving season, that margin expands and the product price rises. Crude is only one input.
Seasonality is built into that. Northern hemisphere heating demand climbs into the fourth quarter, driving middle distillates. Driving and travel demand climb through the summer, supporting gasoline. Refinery maintenance turnarounds usually cluster in the spring and fall, removing capacity exactly when product demand is picking up, which is why cracks can get jumpy for reasons that have nothing to do with crude.
Weather fits here too. Hurricanes on the Gulf Coast shut in both offshore production and refining. In September 2019, for example, Hurricane Harvey took out a substantial share of Gulf Coast refining capacity, and gasoline cracks spiked. The crude price barely moved. This is a recurring pattern worth learning to see.
Why the futures curve matters more than most readers expect
The curve is the price of each future contract plotted by delivery date. Two shapes matter.
Contango means later contracts trade higher than near ones. That is what storage economics look like: it costs money to hold a barrel, so the market charges you for the carry, and that charge is why buying cheap and storing beats using expensive oil today.
Backwardation means later contracts trade lower. Buyers want barrels now more than they want them later, which is the market telling you supply is tight at the front of the curve. Backwardation is generally associated with a tight physical market; contango with a comfortable one.
April 2020 is the clearest illustration of why the curve drives real behavior. Lockdown demand destroyed, nowhere to store the barrels, and in a handful of days storage capacity in the US Gulf Coast ran out. Contracts that required physical delivery became unusable, and sellers who could not take delivery paid buyers to take the barrels off their hands. The front-month WTI contract settled below minus 38 dollars a barrel on 20 April 2020. No one was being paid to produce oil at minus 38. It was a plumbing failure in the futures market expressing itself in the price.
How Do Currency, Interest Rates, and Market Expectations Influence Oil?
Oil is priced in dollars, which adds a layer most commodities do not have. If the dollar strengthens, a barrel that was affordable to a buyer in euros, yen or rupees becomes more expensive to them, and the price in dollars tends to soften. The relationship is not constant, and it strengthens when there is an active macro story to trade. But as a background force, the dollar is real.
Interest rates enter twice. They set the cost of carrying inventory, because storing a barrel means financing the purchase, and they feed into the wider economy that consumes oil. Higher rates make storage more expensive, which deepens contango; lower rates do the reverse.
Expectations do the rest. Futures traders do not need to know what happened, only what happens next. If a report suggests the market will be short barrels this winter, the prompt contract can rally before any barrel has moved. That is why oil often reacts before the data confirms it, and why it can give the move back just as fast.
The acceleration in 2022 had this structure. Sanctions removed expectation of Russian supply, buyers rushed to secure alternative barrels, and the prompt market tightened even before every alternative had been delivered. Positioning followed. Many trading managers say the flow of speculative interest was a consequence of the squeeze, not its cause, and the 2014-2016 evidence is instructive: speculative interest rose in 2014, but the collapse that followed was driven by shale barrels arriving, not by funds exiting.
Finally, oil is one of the most closely watched inputs into inflation, which is why it reaches interest rates. A sustained oil rally feeds into headline inflation, which shapes expectations about what central banks do next. Energy prices carry weight because households feel them directly, which is why they are often treated as a temporary factor and excluded from the longer-run picture. Readers who want the link followed in full should treat the inflation print and the oil curve as one story rather than two.
Why Do Oil Prices Change Geopolitically?
Geopolitics enters as a risk premium: an amount added to the price to cover the chance that barrels stop arriving. Sanctions, war, shipping disruption and pipeline damage all work this way.
The Strait of Hormuz is the example that comes to mind fastest, since so much Gulf production moves through it and the alternatives are limited in the short run. Announcements about it move prices before anything happens. Prices then retrace quickly if nothing changes, because the premium was always conditional.
The September 2019 attack on Saudi Arabian processing facilities is the clearest case of the premium meeting reality. Around 5 percent of global supply was taken offline at once, and Brent and WTI rose roughly 14 percent in a single session. When most of that capacity came back, most of the move came back with it. The lesson: a risk premium is only worth something while the risk is live.
Sanctions do something different, because they can last. Removing a major exporter from the market reallocates real barrels for months, and every remaining buyer bids against fewer alternatives. That is a genuine supply change rather than a scare, and it persists until shipping, insurance and financing routes adapt.
Governments can also move prices directly, by releasing barrels from the Strategic Petroleum Reserve. The SPR was created in the US in 1975 after the 1973-74 embargo demonstrated how thin spare capacity had become. Releases in 2011 during the Libyan disruption and again in 2022 after the invasion of Russia were both intended to take the pressure off, and both were sizeable enough that traders took them seriously. Reserve releases are a blunt tool, useful for short-run relief and irrelevant to a structural shortage.
What geopolitical risk usually does not do is change the long-run cost curve. A barometer of war in a producing region moves until it does not. The price only holds the premium if barrels genuinely fail to arrive.
A Practical Framework for Following Oil Prices
There is a repeatable way to read oil prices without guessing. Five steps, in order.
One: fix the benchmark. If you are following US crude, use WTI and Cushing-linked news. If you are following the international market, use Brent. Comparing a Brent headline to a US gasoline price is comparing two different things.
Two: find the balance. Start with the monthly outlooks from the Energy Information Administration, the International Energy Agency and OPEC’s own Monthly Oil Market Report. They do not agree, which is useful: the spread between their supply and demand numbers tells you how uncertain the market is about fundamentals.
Three: read inventories in context. A draw is supportive and a build is bearish only if it differs from expectations. Compare against the seasonal norm for that week, not against the previous week.
Four: check policy and the curve. Ask what OPEC+ actually committed to and whether it delivered last time, then look at whether the curve is in contango or backwardation. A rally in backwardation has physical support behind it. A rally in contango is more likely to be positioning.
Five: separate the move from the story. Ask whether the change was measured in physical barrels or in headlines. A price response that reverses within days was probably a risk premium being priced and unpriced.
The weekly and monthly market data calendar
Most of the useful information arrives on a schedule. Traders plan around it, and you can too.
| When | Release | What it tells you |
|---|---|---|
| Tuesday evening | American Petroleum Institute weekly inventory report | Early read on crude, gasoline and distillate builds |
| Wednesday morning | EIA Weekly Petroleum Status Report | The authoritative inventory and refinery utilization numbers |
| Thursday | Weekly US petroleum product supplied | Implied demand |
| Friday | Baker Hughes rig count | Direction of drilling activity, best read over months not weeks |
| Monthly | EIA Short-Term Energy Outlook, IEA Oil Market Report, OPEC Monthly Oil Market Report | Revisions to supply, demand and balance forecasts |
One note on the rig count, because it is widely misused. Per-rig productivity has risen for years, so the same rig count now supports more barrels. Read it as a trend over quarters, not as a weekly catalyst.
How crude becomes the price at your pump
The gap between the crude price and the pump price is one of the most durable points of confusion, and it has a straightforward build-up.
| Component | What it is |
|---|---|
| Crude cost | Roughly 2.4 gallons of crude feed a barrel of oil, and a barrel makes about 9 gallons of gasoline, so crude is roughly a quarter of the finished product by volume |
| Refining cost and margin | Energy, labor, maintenance and the crack spread; this is the part that moves on refinery outages rather than crude prices |
| Taxes | Federal excise tax of 18.4 cents per gallon plus state and local taxes, which in many US states exceed the federal level several times over |
| Transport and distribution | Trucking, rail, terminals and pipeline delivery, plus blending to meet seasonal specifications |
| Retail margin | The station operator’s cost of doing business, which is why margins widen in a high-price environment |
Do the arithmetic on a typical barrel of crude at 74 dollars. Multiply by 2.4 to get the crude feed cost of roughly 178 dollars. Add refining cost and margin, which together often run into the 50 to 80 dollar range depending on region and product, then add taxes of roughly 20 to 60 dollars per barrel equivalent once state taxes are included, then transport and retail margin. You land in the ballpark of a pump price in the mid-threes per gallon, and the crude component is only about 40 percent of it.
That is why gas prices can stay high while crude falls, and why they can fall while crude is flat. When pump prices rise, part of what the industry does is give some of the refining margin back. And because taxes are a fixed amount rather than a percentage, they dilute the pass-through of crude moves, which is exactly what the people complaining on forums about high pump prices during a flat crude market are reacting to.
Frequently Asked Questions
No single country, company or organization sets it. Crude is priced on global futures exchanges, chiefly ICE Brent and NYMEX WTI, where the balance between available supply and expected demand, adjusted for inventory, expectations and geopolitical risk, produces a going rate. OPEC+ influences the price by changing how much it produces, not by declaring one. Physical cargoes are then priced over the counter as a benchmark plus a differential for quality and location.
Brent is a waterborne light sweet grade delivered at Sullom Voe in the Shetland, and it anchors the international crude market. WTI is a lighter, lower-sulfur inland grade delivered at Cushing, Oklahoma, and it tracks the US market. WTI usually trades above Brent because of its quality. The spread widens when US export capacity is constrained and narrows when it runs freely, so both benchmarks move but not always together.
No. OPEC+ sets production policy, and the market decides what that production is worth. The group has more influence when it has spare capacity to remove and when its members comply with what they agreed. When commitments are small or compliance is weak, announcements move futures briefly and little else. The 1986 collapse happened when a group with real market power could not hold its members to quota, which is the clearest evidence that influence is conditional rather than given.
On 20 April 2020, the front-month WTI contract settled below minus 38 dollars a barrel. Lockdown demand collapsed, oil already in the pipeline had nowhere to go, and storage capacity in the US Gulf Coast filled up. Contracts requiring physical delivery became unusable, and sellers who could not take delivery paid buyers to take the barrels. It was a failure of storage and futures plumbing rather than a claim that producing oil was worth less than nothing.
Conversion cost and margin together commonly run in the 50 to 80 dollar range per barrel, though it varies widely by region, product and refinery. A barrel of crude yields roughly 9 gallons of gasoline, and about 2.4 gallons of crude feed go into a barrel. Add federal and state taxes, which are a fixed amount per gallon rather than a percentage, plus transport, distribution and the retail margin, and you get the pump price. Crude is usually only around 40 percent of it.
It depends on the period, and the honest answer is that speculation usually follows rather than leads. Most futures positions are hedges held by producers locking in revenue, refiners managing feedstock and airlines fixing fuel costs. Open interest measures live contracts, not direction. In 2022, speculative interest surged in response to a physical squeeze caused by sanctions. In 2014, speculative interest also rose, but the collapse that followed was driven by shale supply arriving faster than expected.
Three reasons. Refining margin moves on its own cycle, expanding when refineries go offline or when demand peaks in a heating or driving season. Taxes are a fixed amount per gallon, so they dilute crude moves and do not fall when crude does. And transport, blending and retail margin are largely independent of crude. That is why pump prices can stay high while crude is flat, and fall while crude is flat.
It has never traded there, and the highest widely recorded intraday print was around 147 dollars in July 2008. Reaching 200 would require a physical supply loss far larger than any recent shock, since the 2022 move stopped short of it despite sanctions on a major exporter. It is not impossible, but the honest answer is that prices of that scale need sustained barrels missing rather than a headline. Forecasting a specific level is a market position, not a fact.
Conclusion: Start With the Market Balance
The answer to how oil prices are set is that nobody sets them. The price emerges on exchanges from the balance between available supply and expected demand, and it gets adjusted for inventory, quality differentials, OPEC+ production policy, the US dollar, expectations and geopolitical risk. Physical barrels then get invoiced as a benchmark plus a differential, which is why a Brent headline is a guide rather than a receipt.
If you do one thing, start with the simplest number: expected supply minus expected demand for the coming quarter. Everything else on the list is a reason that balance came out differently than people thought. Then read the inventory reports on their schedule, watch what OPEC+ actually delivers rather than what it announces, and check whether the futures curve is confirming the story. React to the balance, not to one headline.
Source: https://www.pgm-blog.com/how-oil-prices-are-set/
Anyone can join.
Anyone can contribute.
Anyone can become informed about their world.
"United We Stand" Click Here To Create Your Personal Citizen Journalist Account Today, Be Sure To Invite Your Friends.
Before It’s News® is a community of individuals who report on what’s going on around them, from all around the world. Anyone can join. Anyone can contribute. Anyone can become informed about their world. "United We Stand" Click Here To Create Your Personal Citizen Journalist Account Today, Be Sure To Invite Your Friends.
LION'S MANE PRODUCT
Try Our Lion’s Mane WHOLE MIND Nootropic Blend 60 Capsules
Mushrooms are having a moment. One fabulous fungus in particular, lion’s mane, may help improve memory, depression and anxiety symptoms. They are also an excellent source of nutrients that show promise as a therapy for dementia, and other neurodegenerative diseases. If you’re living with anxiety or depression, you may be curious about all the therapy options out there — including the natural ones.Our Lion’s Mane WHOLE MIND Nootropic Blend has been formulated to utilize the potency of Lion’s mane but also include the benefits of four other Highly Beneficial Mushrooms. Synergistically, they work together to Build your health through improving cognitive function and immunity regardless of your age. Our Nootropic not only improves your Cognitive Function and Activates your Immune System, but it benefits growth of Essential Gut Flora, further enhancing your Vitality.

Our Formula includes: Lion’s Mane Mushrooms which Increase Brain Power through nerve growth, lessen anxiety, reduce depression, and improve concentration. Its an excellent adaptogen, promotes sleep and improves immunity. Shiitake Mushrooms which Fight cancer cells and infectious disease, boost the immune system, promotes brain function, and serves as a source of B vitamins. Maitake Mushrooms which regulate blood sugar levels of diabetics, reduce hypertension and boosts the immune system. Reishi Mushrooms which Fight inflammation, liver disease, fatigue, tumor growth and cancer. They Improve skin disorders and soothes digestive problems, stomach ulcers and leaky gut syndrome. Chaga Mushrooms which have anti-aging effects, boost immune function, improve stamina and athletic performance, even act as a natural aphrodisiac, fighting diabetes and improving liver function. Try Our Lion’s Mane WHOLE MIND Nootropic Blend 60 Capsules Today. Be 100% Satisfied or Receive a Full Money Back Guarantee. Order Yours Today by Following This Link.


| Visits: | 1,834,037,191 |
| Stories: | 8,715,887 |
Whistler Blowers, Insiders

