
Mapping Poverty Rates Across America

America’s economic landscape looks very different depending on where you live.
This map of U.S. poverty rates by state, via Visual Capitalist’s Pallavi Rao, makes that disparity clearer.
Each shade represents the share of residents living below the poverty line, inviting quick comparisons across the country.
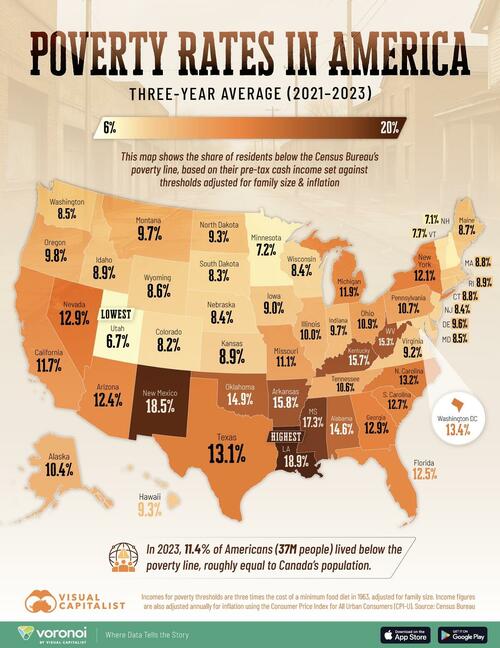
The data for this visualization comes from the U.S. Census Bureau.
The U.S. Census Bureau calculates poverty lines using pretax household income against a threshold at three times the cost of a minimum food diet from 1963, adjusted for family size and inflation.
For reference, this is a quick guide on how much a household needs to be earning to be considered below the poverty line in 2023.
-
One person: ≤$15,480
-
Two people: ≤$19,680
-
Three people: ≤$24,230
-
Four people: ≤$31,200
Ranked: U.S. Poverty Rates by State
Louisiana tops the list at 18.9%, leaving nearly one in five residents below the poverty threshold despite the state’s large energy sector.
| Rank | State | State Code | Share of Population in Poverty |
# in Poverty |
|---|---|---|---|---|
| 1 | Louisiana | LA | 18.9% | 853K |
| 2 | New Mexico | NM | 18.5% | 388K |
| 3 | Mississippi | MS | 17.3% | 501K |
| 4 | Arkansas | AR | 15.8% | 473K |
| 5 | Kentucky | KY | 15.7% | 699K |
| 6 | West Virginia | WV | 15.3% | 268K |
| 7 | Oklahoma | OK | 14.9% | 589K |
| 8 | Alabama | AL | 14.6% | 727K |
| 9 | District of Columbia | DC | 13.4% | 88K |
| 10 | North Carolina | NC | 13.2% | 1.4M |
| 11 | Texas | TX | 13.1% | 3.9M |
| 12 | Georgia | GA | 12.9% | 1.4M |
| 13 | Nevada | NV | 12.9% | 409K |
| 14 | South Carolina | SC | 12.7% | 673K |
| 15 | Florida | FL | 12.5% | 2.8M |
| 16 | Arizona | AZ | 12.4% | 903K |
| 17 | New York | NY | 12.1% | 2.3M |
| 18 | Michigan | MI | 11.9% | 1.2M |
| 19 | California | CA | 11.7% | 4.5M |
| 20 | Missouri | MO | 11.1% | 675K |
| 21 | Ohio | OH | 10.9% | 1.3M |
| 22 | Pennsylvania | PA | 10.7% | 1.4M |
| 23 | Tennessee | TN | 10.6% | 744K |
| 24 | Alaska | AK | 10.4% | 74K |
| 25 | Illinois | IL | 10% | 1.2M |
| 26 | Oregon | OR | 9.8% | 415K |
| 27 | Indiana | IN | 9.7% | 659K |
| 28 | Montana | MT | 9.7% | 109K |
| 29 | Delaware | DE | 9.6% | 98K |
| 30 | Hawaii | HI | 9.3% | 133K |
| 31 | North Dakota | ND | 9.3% | 72K |
| 32 | Virginia | VA | 9.2% | 783K |
| 33 | Iowa | IA | 9% | 287K |
| 34 | Idaho | ID | 8.9% | 172K |
| 35 | Kansas | KS | 8.9% | 255K |
| 36 | Rhode Island | RI | 8.9% | 96K |
| 37 | Connecticut | CT | 8.8% | 318K |
| 38 | Massachusetts | MA | 8.8% | 604K |
| 39 | Maine | ME | 8.7% | 120K |
| 40 | Wyoming | WY | 8.6% | 49K |
| 41 | Maryland | MD | 8.5% | 524K |
| 42 | Washington | WA | 8.5% | 658K |
| 43 | Nebraska | NE | 8.4% | 165K |
| 44 | New Jersey | NJ | 8.4% | 776K |
| 45 | Wisconsin | WI | 8.4% | 490K |
| 46 | South Dakota | SD | 8.3% | 74K |
| 47 | Colorado | CO | 8.2% | 473K |
| 48 | Vermont | VT | 7.7% | 49K |
| 49 | Minnesota | MN | 7.2% | 409K |
| 50 | New Hampshire | NH | 7.1% | 98K |
| 51 | Utah | UT | 6.7% | 226K |
| N/A | U.S. | US | 11.4% | 37.6M |
Neighboring Mississippi (17.3%) and Arkansas (15.8%) tell a similar story of limited job diversity and chronically low household incomes.
In fact, a contiguous belt stretching from Louisiana and Mississippi through Arkansas and up to West Virginia contains every state with poverty rates above 15%.
Historic underinvestment, weaker safety-net programs, and lower average wages all help explain why the South accounts for four of the five worst-affected states.
Northern and Plains States See the Lowest Poverty Shares
In stark contrast, Utah (6.7%), New Hampshire (7.1%), Minnesota (7.2%), and Colorado (8.2%) post some of the lowest poverty figures in the country.
These states benefit from stronger labor markets, higher median wages, and broader access to education and healthcare.
Even populous Midwestern states like Illinois and Wisconsin keep poverty near or below 10%, underscoring how economic structure and public policy can insulate households from hardship.
Geography, then, is a reliable—if imperfect—proxy for opportunity in today’s America.
Population Size Skews the National Picture
Looking only at rates can mask the human scale of poverty.
California’s poverty rate sits near the national average at 11.7%, yet its sheer population means 4.5 million Californians live in poverty.
Texas tells a similar story: its 13.1% rate translates into 3.9 million people, the second-largest total nationwide.
Altogether, the U.S. counted 37.6 million residents in poverty during in 2023, almost the size of Canada’s entire population
If you enjoyed today’s post, check out Mapped: Average Salary by State in 2025 on Voronoi, the new app from Visual Capitalist.
Tyler Durden Sun, 08/24/2025 – 18:05
Source: https://freedombunker.com/2025/08/24/mapping-poverty-rates-across-america/
Anyone can join.
Anyone can contribute.
Anyone can become informed about their world.
"United We Stand" Click Here To Create Your Personal Citizen Journalist Account Today, Be Sure To Invite Your Friends.
Before It’s News® is a community of individuals who report on what’s going on around them, from all around the world. Anyone can join. Anyone can contribute. Anyone can become informed about their world. "United We Stand" Click Here To Create Your Personal Citizen Journalist Account Today, Be Sure To Invite Your Friends.
LION'S MANE PRODUCT
Try Our Lion’s Mane WHOLE MIND Nootropic Blend 60 Capsules
Mushrooms are having a moment. One fabulous fungus in particular, lion’s mane, may help improve memory, depression and anxiety symptoms. They are also an excellent source of nutrients that show promise as a therapy for dementia, and other neurodegenerative diseases. If you’re living with anxiety or depression, you may be curious about all the therapy options out there — including the natural ones.Our Lion’s Mane WHOLE MIND Nootropic Blend has been formulated to utilize the potency of Lion’s mane but also include the benefits of four other Highly Beneficial Mushrooms. Synergistically, they work together to Build your health through improving cognitive function and immunity regardless of your age. Our Nootropic not only improves your Cognitive Function and Activates your Immune System, but it benefits growth of Essential Gut Flora, further enhancing your Vitality.

Our Formula includes: Lion’s Mane Mushrooms which Increase Brain Power through nerve growth, lessen anxiety, reduce depression, and improve concentration. Its an excellent adaptogen, promotes sleep and improves immunity. Shiitake Mushrooms which Fight cancer cells and infectious disease, boost the immune system, promotes brain function, and serves as a source of B vitamins. Maitake Mushrooms which regulate blood sugar levels of diabetics, reduce hypertension and boosts the immune system. Reishi Mushrooms which Fight inflammation, liver disease, fatigue, tumor growth and cancer. They Improve skin disorders and soothes digestive problems, stomach ulcers and leaky gut syndrome. Chaga Mushrooms which have anti-aging effects, boost immune function, improve stamina and athletic performance, even act as a natural aphrodisiac, fighting diabetes and improving liver function. Try Our Lion’s Mane WHOLE MIND Nootropic Blend 60 Capsules Today. Be 100% Satisfied or Receive a Full Money Back Guarantee. Order Yours Today by Following This Link.


| Visits: | 1,725,472,079 |
| Stories: | 8,490,318 |
Whistler Blowers, Insiders
