Recession Probability Falls After Hitting Double-Top
The probability the U.S. economy will see a recession begin sometime in the next twelve months has started to fall again during the past six weeks. after having hit a double-top.
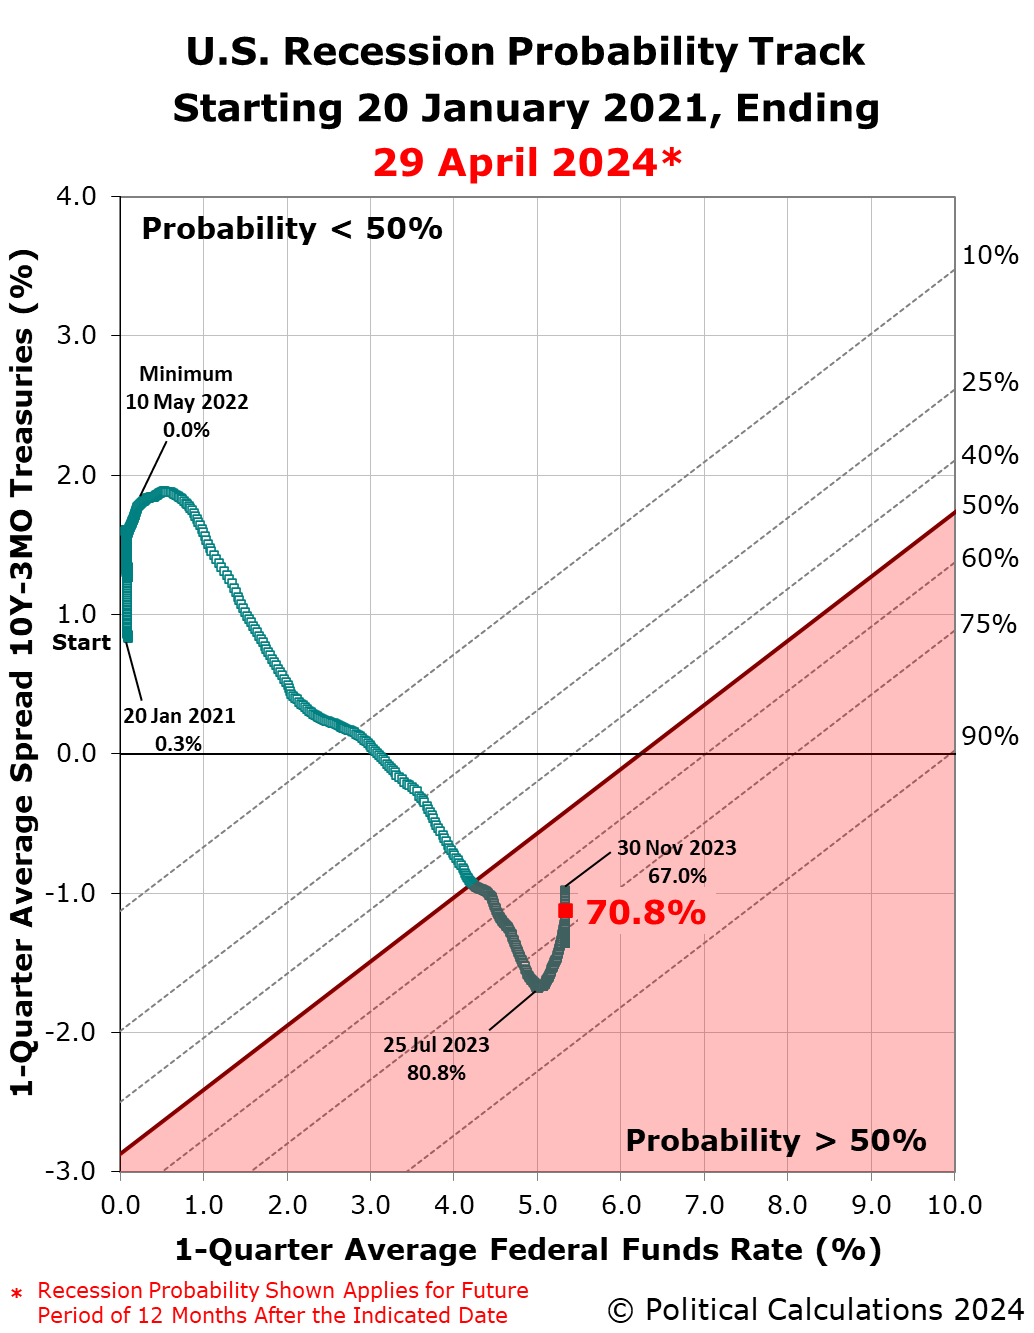
Since our previous update, the probability has dropped from over 76% to just under 71%, confirming the double-top after having previously peaked at 81% in July 2023.
These probabilities are determined using a recession forecasting method developed for the Federal Reserve Board in 2006. They represent a portion of the economic data and forecasts Federal Reserve officials will consider as they meet from 30 April to 1 May 2024 to review how they will set the level of short term interest rates in the United States in the months ahead. The expected timing of rate cuts by the Fed has been slipping later and later during the past six weeks.
The following chart presents the latest update of the Recession Probability Track. It reveals how that probability appears as the Federal Reserve’s Open Market Committee (FOMC) goes into its April 2024 meetings to review and potentially change the Federal Funds Rate (FFR). The FOMC is expected to continue holding the FFR steady at this meeting, but is expected to start lowering this core interest rate at later meetings in 2024. Markets anticipate the Fed may cut this interest rate at its September 2024 meeting.
The Recession Probability Track indicates the probability a recession will someday be officially determined to have begun sometime in the next 12 months. For this update, that applies to the dates between 29 April 2024 and 29 April 2025.
The double-top pattern we’ve described at the beginning of this article can be better seen by simply tracking the recession probability over time. The next chart shows that forecast probability using the data available from 30 April 1983 through 29 April 2024, with the probabilities shown shifted 12 months into the future to coincide with the end of the period in which they apply.
The probability of recession peaked at nearly 81% on 25 July 2023, making the period from July 2023 through July 2024 the mostly likely period in which the National Bureau of Economic Research will someday identify a point of time marking the peak in the U.S. business cycle before it entered a period of contraction. The prolonged elevation of the Federal Funds Rate combined the deepened inversion of the U.S. Treasury yield curve in recent weeks has made the period between 18 March 2024 and 18 March 2025 the second most-likely period that will include the peak of a business cycle that marks when a recession began.
Another way to interpret the double-top pattern is to consider that it extends the period in which the highest probability of recession is elevated. Under that interpretation, the period in which the probability of an official recession starting would be greater than 70% is running from 25 July 2023 through at least 29 April 2025.
Only time will tell if that’s an appropriate way to interpret the data. Looking at the underlying data that’s used to determine the recession probability, we anticipate it will continue falling in the near term, making a “triple-top” event unlikely.
Analyst’s Notes
The Recession Probability Track is based on Jonathan Wright’s yield curve-based recession forecasting model, which factors in the one-quarter average spread between the 10-year and 3-month constant maturity U.S. Treasuries and the corresponding one-quarter average level of the Federal Funds Rate. If you’d like to do that math using the latest data available to anticipate where the Recession Probability Track is heading, we have provided a tool to make it easy to do.
We will continue following the Federal Reserve’s Open Market Committee’s meeting schedule in providing updates for the Recession Probability Track until the U.S. Treasury yield curve is no longer inverted and the future recession odds retreat below a 20% threshold. We’re curious to see how this forecasting method performs.
For the latest updates of the U.S. Recession Probability Track, follow this link!
Previously on Political Calculations
We started this new recession watch series on 18 October 2022, coinciding with the inversion of the 10-Year and 3-Month constant maturity U.S. Treasuries. Here are all the posts-to-date on that topic in reverse chronological order, including this one….
Anyone can join.
Anyone can contribute.
Anyone can become informed about their world.
"United We Stand" Click Here To Create Your Personal Citizen Journalist Account Today, Be Sure To Invite Your Friends.
Please Help Support BeforeitsNews by trying our Natural Health Products below!
Order by Phone at 888-809-8385 or online at https://mitocopper.com M - F 9am to 5pm EST
Order by Phone at 866-388-7003 or online at https://www.herbanomic.com M - F 9am to 5pm EST
Order by Phone at 866-388-7003 or online at https://www.herbanomics.com M - F 9am to 5pm EST
Humic & Fulvic Trace Minerals Complex - Nature's most important supplement! Vivid Dreams again!
HNEX HydroNano EXtracellular Water - Improve immune system health and reduce inflammation.
Ultimate Clinical Potency Curcumin - Natural pain relief, reduce inflammation and so much more.
MitoCopper - Bioavailable Copper destroys pathogens and gives you more energy. (See Blood Video)
Oxy Powder - Natural Colon Cleanser! Cleans out toxic buildup with oxygen!
Nascent Iodine - Promotes detoxification, mental focus and thyroid health.
Smart Meter Cover - Reduces Smart Meter radiation by 96%! (See Video).


